3 things to look for in growth hires

When hiring for a growth team, it’s good to anchor your search around core traits. These traits I’ve come to realise don’t change, rather are built upon as a foundation. Every successful growth product manager, growth designer, growth marketer, growth analyst, growth engineer has them.

If you’re starting the hiring process for growth roles, start here. You won’t go wrong:

  1. Analytical and user-centric

    • Look for a quantitative bias, where the individual is certainly analytical. This doesn’t mean they must be experts at SQL or Python. More so, they must be very comfortable with data, be able to interpret answers and experiments correctly. And some of the following:

      • Can map out user funnels numerically, highlighting drop off rates between funnel stages

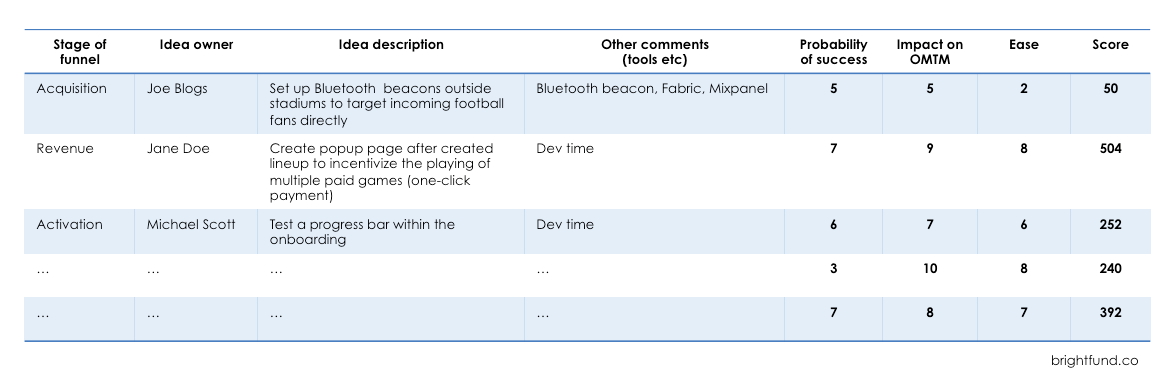
      • Size opportunities from problem spaces, weighing which levers and conversion points are most impactful for your KPIs

      • Effectively segment the user base to help uncover solutions, problems, or sample audiences for experiments

      • Form hypotheses around propensities to upgrade/churn based on own’s analysis

    • Make sure these individuals understand there’s a user behind every data point

      • Critical to know who these users are

      • What these users care about

      • What jobs need to be done from the users perspective to get value from your product

      • What jobs need to be done by your team to provide more value, quicker

    • Key is for these hires to balance both

  2. Marketing DNA

    Marketing DNA does’t mean these hires must be a content marketer or SEO specialist. Rather, they must have routed understanding of marketings value and impact. Some of the following:

    • The value of messaging and positioning, and how getting these wrong can be detrimental to all growth activities

    • Knowledge of the end-to-end user lifecycle and ideally user sentiment at each stage

    • The value of user research and how it provides clarity on problem areas

    • Willingness to AB test things, importantly knowing when and when not to test

    • Behavioural psychology that permeates all experiments

  3. Results & execution oriented

    No brainer. Once hires have shown they can research, learn and set experiments, here is where they put the “growth” in growth [enter almost any role ever].

    • Results

      • They’re super excited about moving numbers. Growth = scientific method applied to business KPIs

      • Showing a relentless drive to improve those metrics - they’re never complacent

    • Execution

      • Thrive in an operating cadence centred around growing numbers

      • Work effectively with other teams, able to get the best out of them

Hope that’s helpful.

When to hire for growth

Post product market fit.

Anything before that, you’re hiring people tasked with growing a product that isn’t properly wanted yet. The best early growth strategy is: talk to every. single. user.

Understand those users needs, how your product is falling short, where they’re really liking it. By following the iterative process around your early users (talk to them > learn from them > iterate for them > build for them > repeat), you may soon find PMF. And at that point, time to hire your growth team with these traits.

Best growth loops in market

As taught in Reforge (highly recommend), there are 2 main kinds of growth loops: micro loop and macro loop.

A micro loop can be described as a standalone loop, centred around 1 core behaviour (e.g. user invite for a free ride). Where a macro loop combines a number of smaller loops (e.g. cross side network effect: when value from one type of user increases as more users of another type use the product).

In this instance, I’m keen to share the best (my favourite) micro loops found in the market.

Calendars

  • Clockwise - calendar assistant to free up day with focus time, by moving rescheduling your meetings. The more users > the more Focus Time calendar slots created in calendars > the more colleagues see the Clockwise focus time sessions > the more signups to Clockwise > repeat

  • Calendly - everyone knows them. The more users > the more calendar booking invites > the more Calendly links sent > the more new people witness Calendly’s value prop > the more signups > repeat

Watermarks

  • Tiktok - when people share videos on other social networks, the TikTok watermark remains, as well as, the username of owner. The more videos shared > the more views > the more downloads of Tiktok > the more videos watched/created > repeat

  • Ring - from Amazon, many videos posted across social (Twitter, Tiktok, FB etc) of interesting, spooky, funny, scary things caught on Ring camera. The more videos caught > the more shared > the more views > the more purchases of Ring by others > repeat

Collaboration

  • Figma - based on the pricing/packaging. Free package allows only 1 project but infinite collaborators. Therefore you get more project creators > more Figma links sent to non-Figma users > more value prop understood > more signups > repear

  • Asana - like Figma, this is primarily an internal loop. More users create a checklist > more assign to colleagues > more colleagues signup > repeat

Free stuff / incentivised

  • Robinhood - Super simple: free stock for referrals. The more users > the more referrals > the more free stock > repeat

3 reasons why the B2B buying journey is more emotional than B2C

Editor’s note: If you enjoy this essay you can find some others about growth, strategy and acquisition. My most popular essay at the moment is debunking the difference between cost per acquisition and customer acquisition cost. Happy reading!

We all have emotions, even in B2B 

There’s a stigma in business. People say B2B buying is rational and emotionless when compared to B2C. Do you agree?

It’s of paramount importance that those in B2B, whether you’re in marketing, sales, operations or product, understand the emotional aspects of the buying journey. It’s very easy for us to remain in the stigma and blindly believe the B2B buying process is just rational and emotionless.

In B2B marketing specifically, we need to craft, create and communicate emotional hooks and stories for our buyers to enter our marketing and sales funnels. From there, our content, copy and creative must continually tap into the buyers emotions to keep the buying intent as high as possible.

That’s all well and good, but it still misses a key ingredient. We haven’t taken into account the act of buying - which has nothing to do with your product, service or value prop.

If we as B2B marketers and sellers understand the emotions triggered in the act of buying, then we will set ourselves up for more success. Those who take out the friction of B2B buying will win.

As Dave Gerhardt, VP of Marketing at Drift says:

“whoever makes it easier to buy wins

The act of buying

A wise man once said: 

“It’s not a problem if you buy the wrong can of soda”

A can of coke is 70p. No big deal if you accidentally get full fat coke rather than Coke Zero. 

It would be an issue, however, if buying that can of coke had multiple stakeholders, took days to drink (implement), had to sign a binding contract, pay at least a few hundred dollars a month and get sign off from the c-suite.

There’s so much more at stake in B2B buying, which makes it more emotional than B2C. 

3 main reasons:

1. People

Buying journeys tend to follow hive mentalities. It’s not just 1 person in a business tasked with buying software. There’s a team working on the project. And you know what a team is made up of? People.

The more people in a team leads to more opinions, feelings and indecision. Luckily teamwork is one of my strengths, but for some it can be hard to grasp. 

Working together on something can bring up tensions, conflicts and heavy debate, especially when there’s pressure involved in deciding the best product, service or solution for your business. So yes, people is a big factor.

2. Cost

If you were responsible for buying software that cost £1 a year, then easy peasy - let’s buy every piece of software out there. But sadly it’s not like that. 

For a tool that costs circa $1,000 per month, you’re spending upwards of $12,000 - what’s that in proportion to what you’re generating for the business? Or even tougher, your salary? 

Maybe you’re the HiPPO (highest paid person in the room) and it’s peanuts in comparison - good on you. If not, the stakes can feel a lot higher as will your emotions. 

The higher the cost, the higher the stakes. The higher the stakes, the higher your emotions.

Emotional steaks for dinner

Emotional steaks for dinner

3. Reputation

You may not know it already - but being accountable for buying a piece of software has huge implications on your reputation within a company. You are effectively stamping your name on the purchase saying “my name is Rupert and I approve this tool”. 

If you’re the one who led the project and ultimately made the decision, then you’re the one who’s held accountable. The pressure is on. And that scenario sends your emotions running high. 

In B2C, reputation isn't an issue. It's not on the line if you buy a can of Coke, buy the premium package on Evernote or purchase a cheap domain for your blog on GoDaddy (those are pretty random examples), but you get my point. If being held accountable, reputation is a factor in the mix.

Conclusion 

B2B buying journeys are more emotional than B2B.

It involves more people to make a decision, tends to cost a lot more and your reputation is on the line. That is the recipe for an emotional roller coaster. 

If we can make the act of buying as frictionless as possible, taking into account people, cost and reputation, then you are setting yourself up for success. 

Don’t forget what Dave Gerhardt, VP of Marketing at Drift says:

“whoever makes it easier to buy wins”

As always let me know your thoughts. If you found this interesting and think your colleagues, friends and family would benefit from reading it then give this a share! It’s wildly appreciated!

If you enjoyed this essay then you can find some others about growth, strategy and acquisition. My most popular essay at the moment is debunking the difference between cost per acquisition and customer acquisition cost.

Source: b2b-buying-journey-more-emotional-b2c

How to build a quick and saucy SEO report...for FREE

Using Google Data Studio [template included]

Whenever I do my in-depth keyword research to highlight the next quarter's focus keywords, I always have this feeling I'm missing something. 

Analytics and tracking. 

Maybe that's because I'm a growth and digital marketer by trait, I always feel the need to track and measure everything. 

But that's the thing, why should SEO (search engine optimisation) be any different? You spend hours researching the top keywords to focus on and create content around.

And for what?

Me building the SEO report...yes I need 5 laptops ;)

Me building the SEO report...yes I need 5 laptops ;)

We need to be able to see, clearly, how this work pays off.

You: "But Rupert, we already have Google Search Console. What more do you need?"

Sure, Google Search Console (GSC) is great. We can see impressions, clicks, click through rates and average position data in the past 16 months (as of recently it was a 3 month look back window)!

The issue I had with this is that it's hard to see real trends as the data is sorted only by day. So you can't sort for weekly, monthly or yearly trends. And if you work for a B2B business, you'll get serious weekend drop-offs like below. 

3 months of Google Search Console reporting

3 months of Google Search Console reporting

I tried to work with it and spent an inordinate amount of time exporting individual keyword data sets and adding them to a single graph to get a wholesome view on our SEO.

I tried. Got fed up. It was awful. 

Too much work little payoff 

Too much work little payoff 

You (again): "But Rupert, why build your own when there are soooooo many SEO-focused businesses out there with awesome products? Like AhrefsMozSEMrushSEOClarity to name a few."

Sure thing.

If you have the cash to spend, go for it. But if you're like many early starters, you need to hack a few things together until you have that cash to burn on a full suite product. 

So I decided to build a workaround. 

A step-by-step guide to building your SEO report

I'm not sure about you, but I'm a visual person.

I want to be able to open up a report and in a split second understand the SEO performance of my focus keywords. A dashboard that shows the overall health of my keywords and much more. 

Below you will find the steps I took to build that dashboard, that has now become the go-to SEO report for our growing team of 20 marketers. 

And just to reiterate for the umpteenth time. IT'S FREE!

Step 1. Google Data Studio

First step to building your saucy SEO report is to connect all the right data sources to Google Data Studio. 

You will want to connect your Google Analytics and Google Searcon Console data sources to the same data studio project. Don't worry it's easy. 

At this stage you're going to want to connect both "Site Impression" and "URL Impression" tables from the search console data source as they provide equally relevant data points. 

Step 2. Report Structure

The most logical way for me to structure the report is as follows.

  1. Page 1 - overview page on top performing keywords/queries

  2. Page 2 - seo focus keyword 1

  3. Page 3 - seo focus keyword 2

  4. Page 4 - seo focus keyword 3

Simple. Saucy

Simple. Saucy

Now we have the three data sources connected, it's time to pull some data through. 

The first page gives you an overall picture of which keywords are ranking highest, which are driving the most impressions and which are driving the most clicks to your site. 

Simply, create a table, pull in query data from search console and add in the metrics you want to see, i.e. clicks, impressions, average position. Be sure to compare these data points by clicking compare to the previous period.

High level. But useful

High level. But useful

On my first page, I have three of the same tables just sorted differently: 

  • by average position and impression - wanted to know which keywords were ranked number 1 and how many impressions they were driving

  • by impression - wanted to know the most visible keywords

  • by clicks - wanted to know which keywords are driving most clicks

These 3 tables should give you enough of a high-level feel of how your keywords are doing. 

Step 3. Deep dive your focus keywords

These are the best pages. It's important to get them right. They are the heart of the report. 

They're also the most fun to create. 

Before we jump into it, you must ask yourself what you are trying to find out. Which questions are you trying to answer? And how should I present the data to do so?

I came up with these four:

  1. What is the average position over time for the focus keyword?

  2. How much traffic is the keyword driving to our site?

  3. What types of content are people interested in around this keyword?

  4. What are the opportunities for growing traffic in this area even more?

These questions helped guide the layout of the deep dive pages. 

Your saucy SEO report that's quick and easy

Your saucy SEO report that's quick and easy

With this report, the aim was to answer the above questions:

1. What is the average position over time for the focus keyword?

Over the 3 month period, you can see the average position has been improving ever so slightly. The positioning has decreased by ~8% to 5.9%. NB: down is a good thing - down means closer to #1, aka ranked first. 

Data source used: Google Search Console

Filter created: "query" contains [enter focus keyword]

2. How much traffic is the keyword driving to our site?

In the same 3 month period, traffic had increased, plateaued and now decreasing. However, the visualisation could be due to the date layout of YYYww.

Meaning, the days are now bundled into weeks and can potentially cutoff some days. That said, we've had +65k unique pageviews to the site from our focus keywords (woop woop).

Data source used: Google Analytics

Filter created: "landing page" contains [specific url]

3. What types of content are people interested in around this keyword?

So I've blanked this out, for privacy reasons, but what you'll see is a big list of all our highest clicked-on landing pages.

I.e. the ones driving the most amount of traffic. Good thing to understand is why are they clicking on these landing pages? Is it the headline? Does that specific landing page tap into a key question your audience is looking for?

Data source used: Google Search Console

Filter created: "query" contains [enter focus keyword]

4. What are the opportunities for growing traffic in this area even more?

This is a great table to create. I pulled in through search console the query data and showed only the keywords ranking between 4-20, based on the seed keyword.

Data source used: Google Search Console

Filter 1 created: showed queries with average positions between 4-20 (i.e. keywords that have room for improvement).

Filter 2 created: query containing [enter focus keyword]

Step 4. put it all together

Now you've got your front page SEO overview and your deep-dive focus keyword pages, put it all together and you have yourself a fully fledged SEO report. 

Which doesn't cost $100+ per month. Again, IT'S FREE!

Conclusion

In this essay, we covered a lot. 

Talked about the limitations of using platform-only data (using search console only to see performance).

How to connect different data sources into the same data studio sheet.

How to give a good overview of SEO health.

And how to setup deep-dive pages on your focus keywords. 

What we didn't cover was design and layout of your reports. Because that's up to you. You have the tools now. 

Go create your FREE SEO report and get that next promotion because your boss will notice you just saved them at least $1,200 a year. 

Template Giveaway

Best thing to do is connect with me on LinkedIn (I'm currently accepting all connections) and ask for the template there.

.....

As always with my essays, I try to help others through my own learnings. If you got something useful out of my musings then please let me know either with a comment, share or even subscribe on my blog if you're feeling quirky. 

I really appreciate it!

You can find more of my writing about growthstrategy and user acquisition on my site Bright Fund. Alternatively you can find my Medium publication, Bright Fund and give it a 👏.

You are not your product's customer

But building it for you is a great place to start

Editor’s note: this essay tackles a problem my cofounders and I faced a few years ago during my time at Dribble. This conundrum is still prevalent for many founders today. Additionally, I am currently a digital marketer at GoCardless but remain an investor at Dribble.

When building your product, it’s natural for you to build it for yourself. I mean you are building this product to help with a problem you personally want to stamp out of existence, right? At least that’s the case for many.

So building the product for you as a customer is a great place to start.

The needs of a few can skew the needs of many

The needs of a few can skew the needs of many

The early users you acquire buy into your solution with a significant time-investment. Early product releases are never perfect, so the users who stick-it-out become your “power users”, providing valuable feedback (about themselves) to help make a better product (for themselves).

The early employees you bring on will have hopefully found the same value from your solution, as well as, buying into the long term vision of the product, so soon start building features to help maximise the reward for your “power users” (and themselves).

At this stage, you are building a product to solve the problem for you, your early “power users” and your early employees. That’s ideal right?

Yes, but only for a fleeting moment. It’s now time to think bigger.

Market Problem

Your target market

Your target market

I personally experienced this conundrum when cofounding Dribble at university. Since we had the solution to a niche problem, the logical use-case was to target those just like us, other students. So all growth, acquisition and product development efforts were tailored to them/us.

If we stuck building the product for ourselves and the university lookalikes, we would have failed, since the market problem was not as prevalent for the segment. The real market problem was with a demographic, polar opposite to students….employed people with disposable income (also football fans and regular punters). This was the potential customer base we were missing and not building the product for.

So, we changed our product and messaging to accommodate. Changes included:

  • Copy. From millennial slang to more succinct and professional. Like SPORTBible getting a job at Sky Sports

  • User journey. To be less around the social side of playing with your friends, to playing to win and making money on the platform

  • Acquisition. To target those that require a higher CAC since they are more affluential

  • Branding. To suit the professional sports fan rather than the young student (notice how young = ⚡)

Dribble logo 2015 - Dribble logo 2016 (which has now changed again in 2018)

Dribble logo 2015 - Dribble logo 2016 (which has now changed again in 2018)

By coming together and working on all (and more) of these changes, we were able to start an ongoing iteration process that lasts today. Thankfully we learnt the lesson laid out by Casey Winters, the growth lead who helped scale Pinterest:

“Your customer focus should always be on new or potential users, not early users”

As Casey mentions, once early value is established, start building the product for the larger market problem. The problem which is incredibly diverse with an insane amount of use-cases. This new product must iterate, grow, evolve to be a living breathing solution to the larger market. Then, and only then, will you have a viable product for the long term.

Dynamic, not static product optimisation is the key.

Shifting away from your early "power users"

Your early "power users" are the dark side

Your early "power users" are the dark side

When tackling a problem, you start with trying to monopolise a small niche within the greater market. If you’re a fantasy football app (using our app as an example) you can’t just jump into the whole sports market as you’d immediately be drowned by insane customer acquisition costs.

You start by focusing on a much smaller but highly engaged (daily fantasy) market.

Listening and learning from your early power users will help you reach great heights within your small niche. But remember this is just a small piece within the greater pie. So if you get stuck only listening and catering to their needs, your growth will be stunted since the ceiling of potential is mapped to that small piece.

Shifting your product and customer acquisition efforts to the wider market at the right time and shifting away from the power users, will hold you in good stead to address the much larger opportunity. This should only be done once you’ve reached product market fit.

How do you know when you’ve reached PMF?

In short, it’s when you have a product worth using by at least a sub-segment of the market. Questions to ask yourself:

  • Is my retention curve flat after 1, 3 or 6 months (length of time depends on your business model)?

  • If I turned off all acquisition and retargeting efforts (including push notifications and email) would there still be healthy usage?

Do note, this essay does not mean you must forget your early adopters. Building a community around the ever growing use-cases and user profiles is the best way to keep engaged your early and current power users.

Conclusion

So, even though your early power users are valuable at the beginning, be aware that they will bias your experiments, skew your data, make it harder to find new users and ask for features to help only their experience. (Note that an increase in power user engagement will be negligible since they’re already using it so frequently.)

The real value is to build the product for your potential customers, focus growth and development on the new users and be the solution to that larger market problem.

-

The aim for this essay is to hopefully dispel any early founders from making a similar mistake my cofounders and I faced. If you found value in this essay and want others to see this, please share.

I really appreciate it!

I'm re-invigorating my LinkedIn profile so feel free to connect. I'm accepting all connections :)

You can find more of my musings about growthstrategy and user acquisition on my site Bright Fund, and if you’re feeling quirky you can even subscribe. Alternatively you can find my Medium publication, Bright Fund.

Demystifying the Difference between CAC and CPA

With help from one of the greatest minds in growth, Brian Balfour (Founder and CEO @ Reforge and ex-Vp of growth @ Hubspot) we will demystify the differences between CAC and CPA to understand where, when and how to use them.

As a guiding principle to your growth strategies, it is important to note these key differences in order to make the best decisions for your growth. The common misconception with these two metrics is that you can use them interchangeably, and that is wrong. 

Firstly:

CAC = customer acquisition cost

CPA = cost per acquisition

Note that customer acquisition is not CPA. And vice versa. 

CAC specifically measures the cost of acquiring a customer, where the definition of a customer is a paying user. Conversely, CPA is the cost of acquiring a non-customer, or more aptly, a non-paying user. This can be anything depending on your OMTM: cost per registration, cost per signup, cost per lead, cost per activation. 

Even though the two metrics are intrinsically different, CPA is used to measure the cost of leading indicators for the overall CAC.    

Models for CAC and CPA

B2C model

Typical B2C models don't require a sales cycle since the conversion time is much shorter. Someone decides in the moment whether to convert into a user (download/register etc). From then, the product would then spend time converting a free user into a paying customer. 

  • CPA - cost per registration, cost per activation, cost per signup, cost per lead

  • CAC - cost per paying user, cost per advertiser (as Facebook example)

B2B model (and Freemium models) 

Conversely, a B2B model (and Freemium model) requires a sales cycle with lead time to convert a user into a customer. Additionally, the CPA of  a user would then be a leading indicator for the overall CAC of your customers. 

  • CPA - cost per signup, cost per lead, cost per registration, cost per activation

  • CAC - cost per paying user in Basic plan, Pro plan or Enterprise plan (or equivalent)

Your model, your customer

At this stage you need to understand and define your business model and customer. Understand who/what a customer is to you and at what stage a user is converted into a paying user. The definition of your customer must stay consistent to dispel any confusion. For CPA, choose your OMTM to be the guiding light for all acquisition initiatives. 

CAC and CPA calculations

Here is the minimum viable CPA equation. Which works for any use-case and OMTM. 

CPA - cost per armoire...?

CPA - cost per armoire...?

Below is the minimum viable CAC equation. It works well for typical B2C models with very short sales cycles and decision making. 

CAC - cool asa cucumber...?

CAC - cool asa cucumber...?

Sales expenses take into account sales salaries, hardware, software, licenses and phone bills, to name a few. Marketing expenses also mean salaries, hardware, software licenses etc. Any expense or cost related to item that helps the sales and marketing teams convert users. 

What the basic CAC calculation doesn't account for are three key instances that will change how we look and structure said equation. How long is the sales cycle between lead and customer (for freemium: how long before user converts to customer)? How do you distinguish a new customer from a returning customer? And what are the costs for supporting a lead (or free user) before converting into a customer?

Sales cycle

Let's say you're a B2B payments platform like GoCardless. A lead comes in, and is initiates contact with the sales team. From this point it takes 60 days for them to convert to the Plus package. By not taking into account the sales cycle when calculating the CAC, you will skew your data and set you up for making the wrong decisions based on inaccuracies. 

For instance, imagine you run a large marketing campaign that launches in October. Your total spend (marketing and sales) for the month hits £50,000 and the users acquired that month is 500. You then divide the amount spent in October by the new users in October giving you a CAC of £100. 

Before this fictitious campaign began, a KPI of yours was to acquire new users at <£80, so in your eyes this marketing campaign actually failed.

However, if you took into account the sales cycle of 60 days, you would have noticed that in December the new users spiked and hit 900. Meaning the £50,000 campaign amount should be divided by 900, giving a true CAC of ~£55. Since £55 is less than £80, the campaign was a success. This would have been missed if the sales cycle was not taken into account.

Taking things further

We can make the CAC even more accurate through using average sales cycle lengths, but we would need to adjust the calculation to suit. Let us assume that the average sales cycle length is 60 days and sales expenses remain constant over the two month period. 

note: n = month

CAC - cost acquisition customer...?

CAC - cost acquisition customer...?

Customer acquisition cost is the marketing expenses of two months ago plus half of the sales expenses of last month plus half the sales expenses of the current month. All of which is divided by the amount of new customers acquired during this current month. 

Marketing expenses in October were £25,000.

Sales expenses in November were £22,000.

Sales expenses in December were £22,000.

New users in December were 900.

Therefore, CAC = (£25,000 + £11,000 + £11,000) / 900 = ~£52

Key takeaways here are to really understand what your average sales cycle is, and to make sure you have a fully loaded CAC.

Fully Loaded CAC

Expenses should include:

  • Salaries

  • Overhead (rent, equipment, coffee)

  • Money spent on tools (CRM etc)

Expenses should include (depending on your business model):

  • Customer success (since your customer success teams improve retention which in turn positively affects customer acquisition)

  • Product, engineering, design (as long as these teams build, create and implement product that influences customer acquisition)

  • Shipping for free trials (if running free trials is integral to incentivising a non-paying customer to become a paying customer)

To make things easy on us, any team, product or tool that is used to acquire new users should be used to create a fully loaded CAC. E.g. if you have a free trial for a product, any costs associated to hosting that free trial should be used as part of the expense. Similarly, if you have B2B businesses with large customer success teams, such as GoCardless, then those should also be added to the CAC expenses since they definitely enhance the user experience and affect customer acquisition and retention.

Conclusion

  • Define what a customer is to your business.

  • Be aware of the differences between CAC and CPA.

  • CPA is a leading indicator of CAC, but they are not interchangeable.

  • Be aware of your sales cycle, if you have one, and be thoughtful when calculating your CAC.

  • Any team, product or tool associated with the acquisition or retention of a customer must be included in the expenses to give you a fully loaded, accurate CAC. 

Guide To unlocking Your Growth Through Facebook Ads

Using This Facebook Ad Framework

This is what 2B MAUs looks like

This is what 2B MAUs looks like

Being able to know your way around a social network of 2B MAUs is pretty useful. It's an ocean of opportunity. And if you have the right tools for this ocean, such as, the right goggles, flippers and scuba gear, you'll not only be able to find the small fish (🎣  ), but also the medium to large ones (🐟 ). Oh heck, you may even find a whale or two (🐋 x2). Sounds good right?

Now enough with the ocean analogies. 

I'll walk you through this robust framework which allows for A/B testing, multivariate testing, optimising and iterating, no matter how you target your users.

How I learnt the framework and strategy was predominantly through jumping in the deep end (ok just one more 🌊 reference) and trying to make sense of things as I went. 

That way does work. But as Brian Balfour put it (and I mentioned in an earlier essay) to learn the most you must put one foot in the known and one in the unknown. If you're like me - who just went full unknown - it's hard to unpack the best practices and structure, resulting in a much slower learning rate. And that is blasphemy in user acquisition.

Let's stay in the green

Let's stay in the green

So hopefully, this essay will allow you to have that little bit of known to make your learning super fast. 

Facebook Ads Basics

Conversion Funnel

Facebook is pretty far reaching and can even help aid you with your conversion funnel and pirate metrics. Well some of them at least.

Quite an offering

Quite an offering

As you can see, Facebook Ads have great use-cases and can help directly with:

  • Awareness - brand awareness, reach, video views, lead generation

  • Acquisition - app installs, signups

  • Activation - engagement

  • Retention - engagement (retargeting)

  • Revenue - conversions, product catalogue sales

  • Referral - asking people to share, invite etc

Targeting

Facebook's targeting capabilities are second to none. They have made it so easy to target their 2B MAU user-base to seriously granular levels. For example, you can target women, aged 35-38, newly engaged, with an income of X+, who own an iPhone on iOS 10 in Okehampton in Devon, England. Granted that target audience will be pretty small and won't be that effective, you get the gist. 

But this essay isn't about these targeting capabilities, rather to give you a framework to help with your overall paid campaigns no matter which stage of the conversion funnel you focus on and however you decide to target.

Facebook Ads Framework

This framework is built for testing. Testing gives us more value. More value means more of your OMTM.  Now let's maximise your ROAS.

Structure

Simply put, when building an ad campaign you have a campaign, an adset and an ad.

Simple setup

Simple setup

Each stage represents something different.

Represent ;)

Represent ;)

Campaign = title

  • Allows you to organise campaigns

  • Because you'll be launching and testing loads

Adset = targeting

  • Targeting your users based on location, behaviour, lookalike, custom fields etc

  • Ability to A/B test different targeted user-profiles

  • Multivariate test different user profiles

  • Set the ground work for testing creatives 

Ads = creative

  • The part of the campaign that convinces targeted users to act

  • A/B test creative

  • A/B test copy

  • Multivariate test creative

  • Multivariate test copy

  • Multivariate test creative and copy

The best structure I have found is for each campaign to have four adsets with four ads a piece, meaning, 16 ads running simultaneously.

A winning formula

A winning formula

Of course, you can change this depending on what you want to test. If you have a top performing adset, then you only need the one adset and test 16 different ads simultaneously to find what drives your OMTM most. 

Another alternative

Another alternative

Similarly, if you have already found a best performing ad, you can replicate that one ad across 16 different adsets (if you have that many user profiles you want to test). You can freestyle.

Testing

Depending on what you are testing - be it different adsets or ads - you'll be structuring your campaign similar to the previous images. At this stage you will have already an idea as to whether you'd like to run A/B or multivariate tests. 

Choosing to run A/B tests means you have one constant and you test the compatibility with only one other variable. Meaning you can test the following:

A/B test one variable, one constant

Simple A/B test

Simple A/B test

A/B testing 4 variables, one constant

Testing four variations of copy against one constant creative

Testing four variations of copy against one constant creative

A/B testing 4 variables, one constant

Testing one constant copy against four creative variations

Testing one constant copy against four creative variations

Similarly, electing to run multivariate tests, you will be testing >1 constants against >1 variables against in an orderly fashion. For example, you can have two copy variations and two creative variations. This allows you to run larger scale tests to give you data driven answers quicker than A/B testing. Like the below:

Multivariate testing two creative variations and two copy variations to find best combination

Testing two copy variations against two creative variations simultaneously

Testing two copy variations against two creative variations simultaneously

The above can be done with varying degrees of difficulty, for example, you can have 4 copy variations and 4 creative variations meaning you'd have 16 testing variations for that one adset.

Once your campaign is structured, your tests are outlined, and you've run it for the first two weeks, you can now make data driven decisions. 

Below is your campaign running an A/B test with 4 creative variations.

Running real fast

Running real fast

Let's say, from the above A/B test with 4 creatives, you now see clear winners in each of your four adsets. Adset 1 shows a clear winner "Creative C". See below:

And the winners are...

And the winners are...

Next step is to iterate three more images based on the winner from each adset to use for the next two weeks. Meaning adset 1 would will then have creatives C, C.2, C.3 and C.4 as the new batch. Similarly, adset 2 will have creatives D, D.2, D.3 and D.4. And so on for each adset. 

Conclusion

This process allows you to iterate on the best performing ads to really drive your OMTM, no matter what stage of funnel you are trying to influence. Continue this iteration process until you find your best performing ads. After doing this particular test for a few months, you will get an awesome picture about which type of ad creative drives your OMTM the most. 

This process can be replicated for testing different copy, different creative, different adsets simultaneously or individually. Best thing to do now is just go out, set the structure, set the tests and press go. 

To summarise this framework:

  • Stages are campaign, adset and ad

  • Set the structure depending on your needs

  • Set the test you want to run, A/B or multivariate

  • Structure the stages around the above, e.g. 4 adsets with 4 ads a piece, meaning 16 ads live at one time

  • Run for two weeks

  • Analyse data to see what is positively driving your OMTM

  • Iterate based on results

  • Rinse. Repeat


If you liked this, you can find more and subscribe on the homepage of Bright Fund. Feel free to check more essays on growthstrategy and user acquisition.

The Most Transferable Conversion Funnel of All Time

The Pirate metrics explained (AAARRR)

Conversion Funnel

Conversion Funnel

I have mentioned these metrics a lot in almost every essay, because they are THAT important.

The pirate metrics were coined by veteran (now disgraced) VC, Dave McClure from 500 Startups with the vision that they are the only true metrics that prove the health of a startup. They form a very adaptable conversion funnel that can be used for every business model. I literally can't think of one that won't work.

A B2B, B2C and B2B2C will have the exact same stages on this funnel, just focusing on different OMTMs (e.g. messages sent, uploads, games played, ARPPU). 

McClure was tired of seeing startups choose a vanity metric as their OMTM, like installs, followers, page-views etc when they would pitch. This wastes time, doesn't provide value and can lead a startup to their demise.

This conversion funnel can provide great structure and light into the overall health of your startup, but also give actionable insight into where you need to direct your time and money within your growth strategy. 

With that said, you should have the metrics to each stage of this funnel at the tip of your tongue. Not to tell everyone you meet, rather so you constantly have best picture of your startups health. 

Editor's note: I have added a stage and changed the order of Dave McClure's original conversion funnel

Awareness = megaphone

Spread the word

Spread the word

Description

The very top of the funnel. The total reach of your company. Goal here is to spread the awareness net as wide as you can to capture the most amount of people in stage two. However, that doesn't mean doing a shotgun styled growth strategy, because those never work. It means understanding your target market, your user-profiles and more importantly where they are en-mass.

Tracking

Depends on what type of awareness you're raising (website views, brand awareness, social chatter etc). Google Analytics, Twitter analytics, Facebook, etc. Mention is a social listening tool.

Measurement

One can look for social mentions, retweets, likes, shares, pageviews, app store views, tagging etc. 

For tips in seeking out best ways to answer these questions, you can see my essays on the 19 channels for growth and how to prioritise your growth strategy

Acquisition is the mission

Up and to the right

Up and to the right

Description

Since we've just raised awareness of the product/service, it's time to convince our potential users to take their first action, such as, subscribing or installing. It is the very first step of the actual conversion process. Awareness has told the user about your business, but acquisition means they started to convert. You convinced them. 

Tracking

Tracking at this stage can be done through a variety of analytics platforms. Personally I've used Fabric for real-time info, App Annie for more detail (although it's normally delayed) and any platform your channels run through, e.g. Facebook.

Measurement

Measure in numbers or rate (%). Up to you. We tracked registrations in both number and % growth rate.

Testing

Run growth experiments using the 19 channels for growth to find your core channels. Continually optimise and iterate those channels until saturated. I have an upcoming essay on Facebook Ad strategies you can use as a template for optimising and iterating your core channel. 

Activation for the nation

A-HA!

A-HA!

Description

The a-ha moment! When your users find the true value of your product and therefore want to stick around (a-ha moment). It can also be when your users have performed a desired outcome e.g. become invested into the product by depositing money (which is not yet revenue), or if the users have played a game/sent a message. 

Tracking

Use any top tier BI software to help map out every single user interaction in your product / service. Personally, I used Amplitude and Metabase - which are both independent of each other, and amazing.

Measurement

Measure the activation rate in %. This is the north star of this stage. You want to continually improve the activation rate and make it as high as possible, so there is minimum time from install to a-ha moment, therefore less time to see value prop and less churn. 

Testing

Tip to find said a-ha moment:

  • Track every single event in your product/service

  • Segment users who started the user-journey with action X, Y and Z

  • Over time you will see which segment was more valuable and positively affected your OMTM - iterate starting points until you find the clear a-ha winner

Retention is king

Graph courtesy of Alex Schultz, VP Growth @ Facebook - the 30 is supposed to be a 0. Blue line shows viable business, red line shows failing business

Graph courtesy of Alex Schultz, VP Growth @ Facebook - the 30 is supposed to be a 0. Blue line shows viable business, red line shows failing business

Description

Shows the true health of your product. It is how you turn the acquisition and activation into growth. If people enjoy your product/service or it truly solves a problem then you will have returning users. As mentioned in a previous essay, you will start with low retention and a leaky product. Plug these holes through a number of tactics (shown below). 

Key thing to look out for is whether you retention curve flattens after it tapers down from day 0. If it is flat you have a viable business, and have reached some level of product-market fit, for some small cohort of your total user-base. This is great news. Now it's time to grow that user-base! 

Tracking

Personally, my product used Amplitude to understand our retention curves. We were able to segment users based on actions performed (such as the activation test mentioned before), to see if any action resulted in higher retention. 

Measurement

Measure the retention rate in %. Whether you choose to measure in a daily, weekly, monthly or yearly rate depends on your business type. We were a weekly fantasy football game so focused on WAUs. An insurance startup might only need annual renewals so would focus on YAUs since their daily numbers would be awful.

Testing

This stage is where you streamline the product/service as much as possible so as to stop churn. In the past I've used:

  • Scheduled social retargeting - Facebook

  • Scheduled and event-triggered email retargeting - Sendgrid and Customer.io

  • Scheduled and event-triggered push notifications 

  • Introducing new features

For the latter, analyse where there is drop-off in the product and brainstorm how a new feature or flow can resolve the issue. Try segmenting users based on behaviour or usage, e.g. top 5% of paying users, then beta test the new solution tailored to stop churn. If this works, rollout. If not, use data acquired as background knowledge to help optimise feature or flow and test again. 

Revenue for the win

Make it rain

Make it rain

Description

Obvious. The monetisation of your users. The fruits of your labour. The revenue made through your business model, be it advertising, subscriptions, gambling or in-app purchases. It's what keeps the lights on. 

Tracking

An important metric to keep track of is the LTV (lifetime value) of your users. From a growth perspective, this is a guiding light to how much you should be spending to acquire new users. By using the ratio LTV:CAC (customer acquisition cost) you can keep a tight grip on growth expenditure. Research says strive for a ratio of 3:1 if you want sustainable growth for your SaaS startup. 

Used Metabase to scrape weekly revenue data.

Measurement

Knowing average revenue per user (ARPU) and average revenue per paying user (ARPPU) were most important for us.

Testing

Similar to the retention test, you can figure out ways to get the most revenue out of users. What worked for us was implementing a popup after someone had just created a lineup and entered into a fantasy football pool game to incentivise them in entering the same lineup in multiple pool games. First tested our top 5% paying users, analysed results and then rolled out. 

At this point in the funnel you can also try:

  • Funnel optimisation - improving each step of the conversion funnel through understanding how users move between them

  • Pricing optimisation - pricing can impact CAC through misplaced positioning, appealing to the wrong customer, and thus spending more to get the right customer 

Referral machines are the best machines

The holy grail isn't just an old cup

The holy grail isn't just an old cup

Description

When a user refers another user. An incredibly powerful way to grow your business. The referred users are already vetted by the existing user, and will have a greater propensity to stick around. Two types of referral: organic and artificial.

Tracking

New users generated by active users. Tracked through app events in BI tools. 

Measuring

Viral coefficient k>1 is the ideal scenario (like Dropbox viral growth) however, that is very unrealistic nowadays. We had a k factor of 0.36 which is pretty darn good in our space. 

Testing

If the users aren't sharing your product organically, then you haven't created a product worth sharing (but that doesn't mean it sucks). You can still create test incentives artificially, such as, discounted prices, more storage, pure cash etc. This all can create referrals. Build a natural referral machine that is integral to your business to continually incentivise new and recurring users to refer friends. 


If you liked this, you can find more and subscribe on the homepage of Bright Fund. Feel free to check more essays on growthstrategy and user acquisition.

How To Run A Growth Experiment

Using the G.R.O.W.S method

Editor's note: I promised another prioritisation essay in last week's piece. This is it. Plus more. Much more. Similar to last weeks piece, best results from this approach happen when you have plugged as many holes as you can in that leaky bucket product of yours :)

In order to get the most out of your growth strategies, having a clear cut process in running growth experiments is paramount. As long as you approach this with some scientific methods - allowing any test to be analysed from a quantitative perspective - then you are on a good path. 

A simple scientific experiment outlined below can be found in any secondary school textbook.

Minimum viable experiment

Minimum viable experiment

We will use the same concept, just in a more scalable way.

The key here is to have an unbiased decision making process when focusing your time, effort and money into finding your core growth channels. Putting your trust into a scientific growth experiment allows you to follow the data rather than your gut (don't get me wrong, your gut is very intuitive, but it won't be able to consistently tell you whether your multivariate-tests-of-the-future will work). It will ultimately help you make the most informed decisions you can in un-earthing the growth for your business. 

There are a few ways (or anagrams) you can follow for your experiments, however, one that has worked for me is the G.R.O.W.S process, coined by the Growth Tribe out of Amsterdam. 

G.R.O.W.S

The G.R.O.W.S method

The G.R.O.W.S method

The G.R.O.W.S process follows this order:

  1. G - Gather Ideas

  2. R - Rank Ideas

  3. O - Outline Experiments

  4. W - Work

  5. S - Study Data

Let's dive in to each stage.

G - GATHER IDEAS

Trello board for backlogged ideas across the Pirate Metrics

Trello board for backlogged ideas across the Pirate Metrics

Creating a company-wide spreadsheet for ideas that popup anytime is great way to start. How I organised our growth backlog is by using the conversion funnel (or pirate metrics) as a guide, going from awareness, acquisition, activation, retention, revenue and referral.

You can take things further by setting up formal brainstorming sessions with the whole company or multiple teams depending on size of co. To get the most out of these sessions, it's best to learn how to brainstorm like a Googler.

Simply put, the growth team ask every individual to brainstorm on their own around a specific stage of the conversion funnel, e.g. user acquisition. Everyone then comes together to flush out the best, most creative and innovative ideas to start ranking. Each person must:

  1. Know the user

  2. Think 10x

  3. Prototype said ideas

R - RANK IDEAS

Next step is to rank or prioritise your ideas. If you take a look at my previous essay on how to prioritise your growth, I map out a prioritisation framework (Bullseye). You can use that or, since we are focusing on experimentation, you can create any simple ranking system to help rank best ideas. Such as:

Who ate all the P.I.E.S

Who ate all the P.I.E.S

What I like about this system is the semi-scientific approach. Good tip is to make any decision a quant one. The image above shows a mixed variety, meaning ideas from different stages of the conversion funnel. It's actually best is to focus on one stage every time. 

O - OUTLINE EXPERIMENTS

Now that you have one highest ranked idea, you can start experimenting. Key here is to design a test that will verify whether the specific idea/channel/approach will be a success or failure. Best way to go about this is to build out an experiment sheet.

Minimum viable version:

Minimum Viable Version

Minimum Viable Version

  • Top ranked idea: Create a popup page after created a lineup to incentivise users to play multiple paid games with one-click

  • Research: Currently we have paying users playing 2 paid games per gameday. This popup page will make it much easier to play more

  • Hypothesis: By using the popup page to incentivise more paid games, we will increase paid games per user per gameday by 50% and therefore increase average revenue per paying user (ARPPU) by 20%

Maximum viable version:

Top ranked idea: Create a popup page after created a lineup to incentivise users to play multiple paid games with one-click

Maximum Viable Version

Maximum Viable Version

Top ranked idea: Create a popup page after created a lineup to incentivise users to play multiple paid games with one-click

  • We believe that there will be an increase in paid games because of a popup screen that incentivises users to play more with one-click

  • To verify this we will send out a beta version with said integration to our top 5% users - without telling them the update - and analyse their behaviour when prompted

  • We will measure number of paid games played (#) and ARPPU (£) to see if there is an increase in either or both due to the integration

  • It is a success if we improve the ARPPU by 20%

  • Results Quantitative: # paid games played up by 75% and ARPPU up by 33%

  • Results Qualitative: users say "very useful", "quick and easy", "organic placement of popup", "much more fun, quick and useful"

  • Next steps are to rollout integration and update game 

W - WORK WORK WORK

Rihanna says it best

Rihanna says it best

This the area that separates the men and women from the boys and girls. You can do a number of things to maximise the effectiveness of your work and experiment, however for me, weekly sprints worked best. They really allow you to laser focus on one goal (the experiment) and truly smash it out the park. No excuses. 

S - STUDY DATA

Which pill...?

Which pill...?

This is where the insights kick in and you make your growth decisions. This is where the test is verified as either a success or failure.

If you get the analysis wrong, you make the wrong decisions. Therefore you could jeopardise your whole growth model. Which could mean the end of your business, depending on its stage of life. No pressure.

Make sure you understand, record and analyse both quantitative and qualitative data for every experiment. Understanding how the users reacted and felt, matter as much as the data behind their behaviour.

Try to find any differences in user behaviour from before, and ask yourself why this has (or has not) occurred. Does it fit with your original hypothesis? Is this healthy, scalable behaviour?

From all of the data you have acquired and consumed you can now conclude success or failure. And depending on answer, either use the data for further background research in future projects, or use to rollout the experiment company-wide. 

Key tools I used were Fabric.io (for real-time acquisition metrics), Amplitude (for retention, segmenting, behavioural cohorting, data visualisation and Metabase (for all data retrieval and querying). 

RINSE AND REPEAT

Rinse and repeating growth experiments

Rinse and repeating growth experiments

Even if your first seven experiments fail, you can use the data acquired as more background research for the next seven. This iterating experimentation process theoretically means the more experiments you run the higher value they become (so by experiment 1,273 you'll be pooping gold). 

Remember, rinse and repeat until you find that one core channel that really grows your business. The one that hits the sweet spot. When you do, ride that channel as long as you can, dig deep, iterate and squeeze as much growth as you can out of it until it's fully saturated. 

Then rinse. Then repeat. 

You can find my other musings here, here and here

How to Prioritise Your Growth Strategy

Leaky bucket?

In the "4 things I wish I knew when cofounding my startup" essay, one of the advice pieces was that every product is a leaky bucket. Test and optimise all aspects of your product - from onboarding, activation, conversion funnel etc - to make it as 'un-leaky' as possible before you go through this process.

Why? Because it will save you time and money

How to prioritise your growth strategy

This is a bullseye - courtesy of myself

This is a bullseye - courtesy of myself

As mentioned in my previous essay about the 19 channels for growth, I promised a follow-up piece on how to prioritise them.

The "bullseye" name and framework was coined by Justin Mares and Gabriel Weinberg due to the three-step approach in reaching bullseye and unlocking your growth. This approach helps you prioritise your growth startegy in a qualitative way that provides more insight than just picking a channel out of thin air. You'll see that the way I use the framework differs slightly to theirs, which means there is room for interprotation. 

I think it's also important to note that there are many ways on how to prioritse your growth strategy, this is just one of them, and one that I found very useful at the beginning of my career. I will cover another type of prioritisation down the line, one that has a few more steps in the process but begins with the brainstorming technique from Google.

Bullseye Prep

Who are you targeting?

To preface the prioritisation process you must have an understanding of who you are targeting. If you are pre-product launch with no customer data then you can target and test different hypotheses with different customer profiles (but one at a time). Simply put, hypothesise who they might be, what demographic, where they are, what they consume and what they do.

For example, this is how I started my own customer profile:

  • Product = Dribble - daily fantasy football app

  • Who = men, 18-21, uni, football fans, premier league, champions league, pub culture, punters, 

  • Where = Oxford (started locally, so where I was when started out, as it's always good to find a niche market, no matter how small, to potentially monopolise)

  • What they consume: football highlights, football fan pages

  • What they do: 5-aside football, season ticket holders, pub culture, FIFA, Pro evo

The One Metric That Matters For Acquisition

Once you have your target customer profile, it's time to understand the one metric that matters (OMTM) for your acquisition. Is it pure installs, registrations, activations, or further down the funnel with revenue or games played / messages sent? The OMTM is different fo every business so really think what your product is trying to do. For Dribble, we targeted activations, so users that have installed, registered and deposited money.

This metric will be your north star, so for every channel you look at you need to think "how is this going to drive [enter your OMTM]?" and then test, optimise and iterate to really maximise results. Focusing on one metric really helps, and advice would be focus on metrics further down the funnel, away from the vanity metrics like installs. 

19 Channels For Growth

Last step in the preparation process is the brainstorm session, which is often the funnest part. The key takeaway here is to take your time with every acquisition channel, don't disregard any and understand one way you can drive acuisition.

E.g. looking at the channel "content marketing", are you going to focus on writing long form content, making a series of infographics, get into podcasts? How will you distribute to acquire the user profile you created at the beginning? Will that be on Medium, reddit, Instagram? 

When brainstorming, always keep in mind your user profile and OMTM. How do you think your user profile will react with that specific acquisition channel, are they known for using said channel, and how will that channel positively affect your OMTM? 

What helped me was listing out all 19 channels for growth on a large white board with space to input where and how you'd use each channel.

19 channels listed

19 channels listed

Bullseye Framework

Prioritisaiton

There are three sections in the bullseye framework. The outer ring, the middle ring and the onion ring...only joking, it's the bullseye. 

So once you have all channels listed with ways you can leverage each, think about how relevant / promising / effective each are by rating each channel with 1,2 or 3. 

The priority key

The priority key

But it's not that simple.

To help prioritise, you can only choose three channels for the bullseye, four for the middle ring and 5 for the outer ring

The onion ring structure

The onion ring structure

At this stage you might have 5 channels with relevance score of 1, so the two channels you don't put in the bullseye will be the first to fill out your middle ring. Then from there you have two spaces for your number 2's, which will then overflow into the outer ring. Get the jist?

Prioritised Bullseye

Prioritised Bullseye

Testing

Once you have completed the qualitative part of the bullseye diagram it's time to start with the quantitative! Because at the end of the day, data is king and will tell you where to spend your time, money and efforts.  

The first channels you start testing are the innermost. To do so, set aside a small amount of budget with a timeline, for instance, £1k to be allocated to the first three channels in total and run for a month.

At this stage, one or more channels will have started to perform better than the rest. If there is a clear loser(s) after the first month, swap in the equal amount of poor performing channels with ones in the middle ring. If all three are performing relatively similarly, test a little longer to find a statistically significant difference. 

Keep swapping out channels in and out of the bullseye ring - while testing them over the same amount of time and budget - until there is a clear winner. This winner is your core channel and the one you should focus on.

How to keep momentum

The distribution of growth from the 19 channels follows the power law.

Distribution of growth among channels

Distribution of growth among channels

There really is only one channel at a time that brings in most of the growth. However, you can't rely on that singular channel until the end of time. Each channel has a saturation point.

You need to be able to squeeze every ounce of traction out of your core channel before you move on. To do so, you must focus, dive deep and continually experiment to find out exactly how to optimise growth. You will uncover new and effective tactics and try to scale them until you reach the saturation point. You will know when you've reached that point because growth will have stagnated, no matter what you do, and costs will no longer be sustainable. 

Common Mistakes

We've all been there...

We've all been there...

When testing, it's quite common to have multiple channels working but with varying degrees of success. For example, you test online ads, influencer marketing and SEO. They all work well, however, influencer marketing works far better in terms of cost effectiveness and scale, but you elect to keep all three going. This is a common mistake that must be prevented. Really focus and specialise on the singluar channel that works well. 

If no traction channel is significant by the end of testing, then you must go through the framework again. However, this time you'll have data to work with about previous experience, copy, tone of voice, language, creative etc. If you have gone through this process a number of times and still no real results, then you still have a leaky bucket. Fix that first. 

Hope this has helped you in prioritising your growth startegy. It sure helped me.

FYI - after running my growth strategy through bullseye targeting, I found my core channel. It started with social ads, but after saturation point it became, and still is, partnerships. Things move. Don't worry.

... 

If you enjoyed this, catch my other essays on "how I launched my iOS app", how I'd improve it19 channels for growth, "4 things I wish I knew when cofounding my startup" and 5 podcasts to listen to. 


5 Podcasts to Listen for Entrepreneurs, Growth Marketers and Tech Enthusiast

When I’m not listening to True Crime podcasts, I’m listening to more uplifting and aspirational ones. Ones that get me talking, thinking and sharing. I believe to be a huge channel of growth for some of these podcasts due to the voume of WOM marketing I do.

With this in mind, I thought I'd make it formal and write a small synopsis on which podcasts you could be listening to to stretch your mind.

1. Recode Decode hosted by Kara Swisher

Recode Decode with Kara Swisher

Recode Decode with Kara Swisher

Why: one of tech's most promininent journalists, Kara Swisher is known for her insightful reporting and straight shooting style. She's also a G. Really gets to the heart of an issue, she's matter-of-fact with a quick sense of humour. The episodes are timely and chat about all recent news, from Uber's sexual harassment, Amazon's purchase of Whole Foods, Trump's America and the state of innovation. 

Episodes:

Length per episode: 1 hour

2. The Growth Show by Hub Spot

The Growth Show by HubSpot

The Growth Show by HubSpot

Why: Podcast for executives, entrepreneurs that shares stories on what it's really like to grow a business, a movement, an idea, or a team. On the shorter side (time, so perfect for a lunch break or commute to work. 

Episodes

Length per episode: 30 mins

3. Growth Marketing Toolbox

Great for new tech

Great for new tech

Why: Discover the latest and greatest gorwht marketing tools and technology. Each week, Nicholas Scalice from Earnworthy, interviews marketers, product creators, startup founders, marketing technologists etc to unbox what tech and tools they use (or even make). 

Episode:

Length per episode: 30 mins

4. Masters of Scale with Reid Hoffman

Reid Hoffman

Reid Hoffman

Why: Quite a comically edited show with lots of sound effects. Aside from that, Reid Hoffman (cofounder @ LinkedIn and Greylock, shares how companies grow from zero to gazillion through interviews with some of techs most influential entrepreneurs. Such as, Mark Zuckerberg, Sheryl Sandberg, Reed Hastings, Eric Schmidt, Sara Blakely.

Episode:

Length per episode: 30 mins

5. Zero to Scale: two entrepreneurs take you behind the scenes in a journey to $100k per month and beyond

Zero to scale podcast

Zero to scale podcast

Why: full discolsure: I haven't started this podcast yet but I've heard great things and is on the list once I've finished all of the above. It's about two entrepreneurs who take you through their own businesses in real time week by week to share how they are growing it from $0 per month to $20k and beyond. That includes sharing updates on wins, losses and leasons learned. It gives an honest, emotional and transparent view into the growth od two businesses.

Episodes: I'll be following the journey from the beginning

Length per episode: 30-45 mins

If you want to read some of my other musings you can check out "how I launched my iOS app", "how I revised the launch", "4 things I wish I knew when cofounding my startup" and "are there really only 19 channels for growth?"

Are There Really Only 19 Channels For Growth?

19 channels for hockey stick growth

The ever sought after hockey stick growth graph

The ever sought after hockey stick growth graph

When strategising on how to grow Dribble, the book "Traction" by Justin Mares and Gabriel Weinberg (which is amazing), was a go-to resource. They did a tonne of research into customer acquisition channels, interviewed startups and founders to hear their success stories on how they grew, and ended up with a pretty concrete list of 19 channels for growth.

The theory behind this list is that they are the only true channel that spur on growth, and within it you can find the 1-2 channels that will scale your business. However, I wanted to dig a little deeper into a few success stories to understand whether we need to add, subtract or keep the same number of channel groups on this list. 

Customer Acquisition Channels

Here they are in all their glory

Here they are in all their glory


Let's dive in

Andrew Chen wrote an incredibly fascinating article about "what's next in growth", where he actually looked in the past to predict the future. Personally this article gave me greater foundation in how I foresee the evolving growth landscape. If you don't want to read the whole article here are my key takeaways: 

"technology changes but people stay the same"

-

"ignore quick growth hacks. Only trust ideas that are 100+ years old"

-

"growth opportunities will come from taking classic strategies - the stuff that's been around for 100 years - that are fundamentally anchored on human behavior, and anchoring them on new technologies while executing them"

-

"growth opportunities follow: classic strategies x new platforms x smart execution"

When you think of growth you think cutting edge, you think new, you think tech-enabled. These are all true, however, the channels listed above aren't new concepts. They are not new channels that have only arisen since the launch of Uber, Airbnb, Facebook or Slack. They all came about many years ago - think pre-world wide web - and will remain 100+ years longer. As Andrew Chen quite rightly stated, they are anchored on human behaviour and we all know that hasn't changed...ever.

Let's look at some of the channels we might perceive as "new":

Engineering for growth (side projects)

A beautiful FREE stock photo from Unsplash

A beautiful FREE stock photo from Unsplash

Definition: the building of a product or service that can have a positive impact to your core product or service.

Who - Crew and Unsplash

What did they do - Crew gaveaway their remaining high-res photos on a standalone site, Unsplash, with the goal to funnel in a new batch of users. The site was an mvp, they posted it on hackernews and waited. Within 24 hours they maxed out Google Sheets subscriber limit (it's 20k if you don't know) and funneled across a whole new set of users to Crew that envigorated their business. 

Why did they do it - they were running low on cash for Crew and needed to change their business model to stay afloat. Not only does this channel mean one builds a new product to influence another, it is anchored on a seperate growth channel, virality (wom)

Human bahaviour that influenced growth - since they gave away a VALUABLE in-demand resource FOR FREE, the community responded extremely well, spreading the word organically.

Old example of when it came about - the concept of side projects to influence a core project/business is not a new phenomenon. You see this a lot in the music industry. For instance, in 1978 the group KISS decided to run side projects where each band member simultaneously launch with a solo album to help boost the overall bands popularity and sales. Just like Crew and Unsplash, it worked. 

Existing platforms (OPNs)

The now infamous Airbnb cold email to Craigslist-ers about hosting on Airbnb. From the anonymous Jill D...who was most likely Brian Chesky himself

The now infamous Airbnb cold email to Craigslist-ers about hosting on Airbnb. From the anonymous Jill D...who was most likely Brian Chesky himself

Definition: leveraging existing platforms or networks to grow your product/service. 

Who - Airbnb

What did they do - they found that the majority of their users and the overall market were listing and renting their houses on Craigslist. Ingeniously, they developed a way in which any Airbnb listing was given the option to list on Craigslist (even though it was not allowed), giving them much more reach than organically through their own products. All click throughs were re-directed to Airbnb and now we have a global phenomenon. This was just the beginning...they managed to do A LOT more to make it where they are now

Why did they do it - through market research their target market was already on Craigslist and wanted to leverage their network to bring on growth

Human bahaviour that influenced growth - using OPNs, you leverage any behaviour the existing network has already tapped into. This means the behaviours vary depending on network and whether they already "own" your target market.

Old example of when it came about - Brownie Wise from Tupperware, back in the 1950s, leveraged other peoples networks on a smaller scale (it can also be seen as an affiliate network). By tapping into the small gatherings of women to showcase the Tupperware product and sharing revenues with the women, Wise built a vast network of other peoples networks to grow the brand. 

Virality (word of mouth)

Snapchat logo - how's your Snap inc. stock doing?

Snapchat logo - how's your Snap inc. stock doing?

Definition: in the case below we are using an organic viral channel, word of mouth. Not to be confused with artificial viral channels such as referrals or viral loops.

Who - Snapchat

What did they do - initially launched the product in college campuses (a select few) in the hope of initiating natural word of mouth. Although this tactic didn't succeed as planned, launching the product in select high schools did. Within a a few months the product became viral with main source of growth being WOM.

Why did they do it - cheap quality growth. It is inherent to the product that the word be spread because people need friends to send (naked pictures) snaps to. The network only gets stronger the bigger it gets. It's also the dream if your product inherently attracts new customers by being freaking awesome. Everyone wishes it, but only the few can capatilise. Has to be both organic to customer experience and expertly executed.

Human bahaviour that influences - Evan Spiegel believes Snapchat "makes communication a lot more human and natural". In this broad statement, he must also be referring to another human behaviour, sex. People enjoy sending NSFW pics to people since they last between 1-10 seconds and given the relative toxic environment high schools can be prone to, Snapchat was a great fit and spread like wild fire. Of course not all snaps were nudes, but you get my drift.

Old example of when it came about - a long long time ago, before internet, advertising, or any other formal marketing technique. If something was good, people told other people. Simple. But in 1970 - George Silverman, a psychologist, pioneered word-of-mouth marketing when he created what he called "teleconferenced peer influence groups" in order to engage physicians in dialogue about new pharmaceutical products. And that is all I will be talking about pharmaceuticals...

Influencer Marketing

Kim and Kanye = influencers

Kim and Kanye = influencers

Definition - leveraging the network, influence, brand and trust from a person of interest (someone with a following) to grow your product or service

Who - there are hundreds of big companies who use influencer marketing, from the likes of Nike, Adidas, (pretty much any retailer), but I thought I'd give a little guy a chance - Dribble

What we did - found a niche on Instagram and Youtube across football fan pages of Premier League teams and "signed" their accounts to our "network". This later became a standalone influencer agency called Ninetylabs. We designed all creative to be posted across accounts and managed the campaigns across 100+ influencers totalling a reach of 10m football fans.

Why we did it - drive growth from a very active following and capatilise on the influencers trust. The networks we were creating already owned our target market.

Human behaviour - trusting a peer. The influencers build a following based on trust of their brand, tone of voice and opinions. Can be very powerful when coupled with a product/service that matches their audience

Old example of when channel came about - influencer marketing came about in the late 1800s with the likes of "Aunt Jemima - Pancake Flour", leveraging a fictitious persona to be a trusting face, name and character to sell flour. This was an artificial form of influencer marketing, since they made up the character (similar to Santa Claus from Coca-Cola). A little later in the 1920s Babe Ruth (the baseball player) was used to sell Tobacco chews. That could be the first real example of influencer marketing leveraging his fame and influence across the sporting communities in the US. Very interesting to see now how the adoption rate of influencer marketing has sky rocketed with many agencies popping up, such as, Butter Milk

What this means

The common denominator here is that all channels were invented/created/established a long time ago (50-100+ years ago). You can pick and choose any channel on the list and find the roots run deep around the cusps of revolutions and the beginnings of corporations. In light of this, I do believe the list is robust enough to maintain all 19 channels.

From the early days of these channels, the medium or platforms which customers are acquired has changed, however, the human behvaiour that drives said acquisitions has not.

That means one can predict the channels will remain the same while the platforms and technology will differ greatly.

The Future of Growth   

With this in mind, the new technologies will be leveraged across the classic channels to be executed in a way that will drive real growth.

Inspired by @andrewchen

Inspired by @andrewchen

Using the above image, try to imagine ways the classic strategies can work with emerging technologies. Such as:

  • influencer marketing with VR

  • building a machine learning side project to help facilitate growth 

  • leveraging A.I to analyse creative and copy to make better design decisions across your online advertising campaigns.

Today you are starting to see some of the lines blurring, especially in the advertising industry where automation is taking over ad exchanges through programmatic. 

In conclusion, this has lead me to believe the customer acquisition channel list is robust enough to maintain all 19 channels. Each channel has a deep rooted history anchored around human behaviours. This pairing is vital and can be leveraged across any emerging technology, and that's where the innovation will lie. Emerging tech and emerging platforms will be where people win and lose. Keep an eye on how you can use the 19 channels and strategies across the new platforms and tech popping up. There is a movement happening, better get in front of it now. 

In addition, the channels themselves are intentionally quite broad terms and we should actually call them "channel groups". Reason being, you can have a load more sub-channels within each of them e.g. "content marketing" can mean either podcasts, infographics, video, long form blog posts etc etc. So one channel group can represent 5-10 channels, meaning the list could actually have the potential of being 190 in total. Other groupings are: "viral marketing" where you can have organic virality or artificial virality; "influencer marketing" where that can be guest writing on blogs or influencers on social networks. You catch my drift. 

Brains

Brains

FYI when using the customer acquisition list to form your growth strategy, in my last essay on the "4 things I wish I knew when cofounding my startup", I reference you should not go through this list in an organised fashion from top to bottom, rather through deductive reasoning by looking at your core business model and specific KPIs to judge where to begin.

E.g. if you're a mobile game whose goal is to hit 1m active users within the first year, 1-1 "sales" maybe won't be that channel to scale your business. however, would probably work if you're a B2B SaaS business selling enterprise business intellignence tools (since they'd probably be looking for 10 enterprise clients).

From there you can use a few growth processes to get the most out of each channel. Such as the G.R.O.W.S process, courtesy of the Growth Tribe.

P.S in light of the 19 channels for growth, the way Justin and Gabriel (yes we're on a first name basis) prioritise where to focus is through bullseye targeting. I will jump into in a follow up essay about this and how I aprroached it with my team.

If you like the above, feel free to check out "how I launched my iOS app" and how I'd improve it. And don't forget to signup to my newsletter for early access to content.

4 Things I Wish I Knew When Cofounding My Startup

Sharing what I wish I knew when cofounding my startup, Dribble

Brains

Brains

When you're in the (startup) trenches its pretty difficult to see over the banks. Not only is there a wall of dirt in front of you, but you are also victim to tunnel-vision. You're working on that integral campaign, feature or creative that NEEDS IMPLEMENTING ASAP, no matter how small it is. In fact, there's so much tunnel vision that the size of said feature or campaign doesn't even register. To you, it's the be-all and end-all. The only thing that matters.

This has happened to me. A lot. Trying to keep an eye on the big picture while getting down and dirty with growth is no easy feat, and I'll be honest, it's still an ongoing battle. 

But, now I'm here writing this essay roughly 2 years after those trenches with the luxury of being able to reflect on what I wish I knew. And oh how it looks so easy from here. How simple, how rudimentary. I have no idea why I struggled so much. 

And that my friends, is why hindsight is 2 things:

  1. 20/20 and,

  2. a b***h

So here's what my passed self would have loved to know before getting in those trenches. 

1. Your product is a leaky bucket.

No shame in knowing that's what your product looks like. It was the same for me

No shame in knowing that's what your product looks like. It was the same for me

Plug those holes before you start trying to fill it

Get those rose tinted glasses off and be real. Your product is a leaky bucket when you start off. Before starting to really implement any robust growth strategies, start from the bottom of the funnel - your product. 

Only once in a blue eon does a product overflow with growth because it's bullet proof right off the bat. Snapchat is a prime example of attracting growth and being pretty darn close to bullet proof since launch. However, it wasn't perfect - they still had a lot of work to do. Even if you make the holy grail that shows early signs of no holes and you think will never sink, I'll just say one word, Titanic. 

We thought we had great product at launch, because our beta testers had very healthy behaviour playing multiple games per match-day and creating a small buzz through WOM. But in actual fact, when we formally opened up the doors and turned on a growth tap we saw holes appear. 

On-boarding flow had holes as we asked for people email and phone number (chose this due to other similar product types doing the same), the KYC verification page was a very tough cookie to crack in terms of placement and provider, the journey from registration to game played needing optimizing and finally how users could invite friends to challenge needed addressing. So we had our work cut out for us.

The hard thing was the air of investor pressure - to show signs of early growth and healthy product behavior - was around so I really tried to keep the growth tap on without a whole company effort to optimize the user journeys as quickly as possible. 

What would have helped us is if we segmented our company wide goals to focus on customer journey first (customer surveys/focus groups / analytics etc), prove healthy behaviour and market product fit, then focus on growth. 

It's a constant process and a company-wide objective to get your bucket fixed. Really dig deep into your analytics platform (Amplitude/Mixpanel/Metabase) to find where the holes are and fix them. To help flush out these holes you can run a few growth experiments, such as, controlled Facebook ad testing to pump a few 100-1,000 targeted people into the product to study behaviours. Doing this will:

  1. flush out holes in controlled experiment (understand onboarding flows, registration flows, app store conversion, finding the a-ha moment and overall retention)

  2. practice your paid advertising techniques

  3. help you hypothesize and test new user groups to target

All of the above will set great groundwork for the future growth strategy you will implement.

2. To become the master, you must master the basics

Master the basics you must

Master the basics you must

It goes without saying, if you want to become a master, you should master the basics. From a growth perspective, the basics aren't growth related. Think Karate Kid and the wax on wax off scene. He's not training to wax a car, he's just practicing his movements which will mimic the way he moves when whooping butts.

With this in mind, the basics of growth are all pillars that intersect with product, data and marketing, namely, behavioural pyschology, branding, storytelling, positioning, design, UX principles, programming, statistics and data analytics.  

Brian Balfour is a G and has great advice in shaping yourself like a T. It is frustratingly true, and I say this because I didn't know this when I started.

Source: Brian Balfour, Coelevate

Source: Brian Balfour, Coelevate

I, like many people out there, jumped into the channels before truly mastering the basics (similar to how I approached growth before optimsing the user journeys in the product). I started to "master" channels before mastering the driving forces (user behaviours and storytelling behind this). And in using this approach you can never truly master anything. 

So. since I have an honours degree in mathematics, I have a good understanding of statistics and data analysis, so personally, my focus has been on customer behaviours, storytelling, psychologies and design principles. It's been a very enriching experience learning these basics and building on them. I wish I had started learning and mastering these base layers before I cofounded Dribble because I'd be much more advanced in my experience than I am now. 

So, to my past self: "start now because no one ever said "I wish I mastered those skills later". Idiot."

3. Don't try to look for those Quick tricks, hacks or bullets

Hockey stick, not "hacky" stick

Hockey stick, not "hacky" stick

Everyone loves a success story. Especially the ones where a startup/founder is praised for using one trick or hack that resulted hyper growth and were shortly after unicornified (is that going to stick...?). They tried things like leveraging Craiglist for growth (Airbnb), integrating contacts and referrals in onboarding (Whatsapp), viral loops (pick one), Facebook Open Graph (one of the early adopters like IamPlyr), or added one feature that started the hockey stick.

I think an inherent reason why we love that concept so much is because you risk a limited amount (time) for maximum gains. Of course I fell victim to this, where I was hell bent on trying to figure out our one trick, or hack that would provide similar growth. 

But growth doesn't work like that. It's a consistent process of experimentation. You need to straddle two mindsets, creative and methodical. Creative in your process of choosing which channels to experiment first (using deductive reasoning and brainstorming) and methodical in how you execute it. An awesome growth process is the G.R.O.W.S process from Growth Tribe. Don't fall into a traditional trap of trying every channel once over a period of time until you find it, as that wastes vital time. 

You need to go through these creative and methodical motions, experiments, and theories to find the 1-2 channels that provide most growth, since it follows the power law. Meaning, only 1-2 channels will provide all of your growth. Could be WOM, SEO, paid ads, sales, content marketing etc. It follows this law because your business should find product-channel fit (more on this in follow up essays) where your product or business integrates intuitively into a specific channel, effectively built for the channel, rather than having the channel built for the product (impossible to do the latter). 

Way's in which I'd deduce channels to try: look at the competitive landscape, what are similar products doing to grow, what works well for them, what doesn't? What are new technologies or platforms that you can leverage for growth? Any blue ocean channels?

4. Keep one foot in the known and one in the unknown

If only learning would be that simple

If only learning would be that simple

I have come to understand that learning isn't linear. If you start on date A you are not on an even gradient of learning Y-amount every X-time-frame until you leave on date B. In truth, I see it as being more of a normal distribution, not over time, but rather between areas of known and unknowns, depicted below. 

The learning play ground. Inspired by Brian Balfour

The learning play ground. Inspired by Brian Balfour

To maximise learning, you need to make a conscience effort where you would like to be on the above graph.

When cofounding Dribble, I made sure to live in the unknown area, because "that's where I'll learn the most". In theory, this is true, because if it is unknown then it can only be known (very profound, I know). So I spent close to 100% of my time on tools, projects and areas I knew nothing about without even a slight understanding of a base layer. 

Alternatively, being at such a high stakes stage of the company it felt counter intuitive to work on things I knew very well already. If you know how to use a tool or understand a topic like the back of your hand then your learning is saturated. 

Clearly, being at either side of the bell shaped curve isn't ideal so one must actively work in a 50/50 capacity between known and unknowns. The closer you are to the 50/50 split the more you learn (depicted by the green area with the victorious icon). One reason being, if you're living in the 100% known, this easily leads to boredom, and if you're living in the 100% unknown, this leads to frustration. Another reason being, you can supplement the unknowns with key learnings from the knowns to help cognitive development

I hope that helps! It would have definitely helped my past self. More on my startup journey and reflections you can find my previous essays on how I launched my app and how I'd improve it.


Revision on "What I Did to Launch my iOS App"

Growth is very nuanced. There is a unique intersection between marketing, product and data where this field really gets interesting. It requires both creative and analytical capabilities to really succeed. My journey into this field began when cofounding my startup Dribble. In an early attempt to document this journey I wrote about how I launched my iOS app.

As mentioned in the previous post, the essay depicted the launch strategy I used, as well as being used as a content marketing campaign. Since hindsight is 20/20, I thought it best to look at both the launch strategy and the campaign in one go. 

I plan to tackle this revision by looking at the bigger campaign-picture, in terms of how I set the campaign goals, the user hypothesis, how i constructed the conversion funnel and the top-line performance, but also critique what parts of the launch strategy I'd adapt. 

Read More