The Pirate metrics explained (AAARRR)

Conversion Funnel
I have mentioned these metrics a lot in almost every essay, because they are THAT important.
The pirate metrics were coined by veteran (now disgraced) VC, Dave McClure from 500 Startups with the vision that they are the only true metrics that prove the health of a startup. They form a very adaptable conversion funnel that can be used for every business model. I literally can't think of one that won't work.
A B2B, B2C and B2B2C will have the exact same stages on this funnel, just focusing on different OMTMs (e.g. messages sent, uploads, games played, ARPPU).
McClure was tired of seeing startups choose a vanity metric as their OMTM, like installs, followers, page-views etc when they would pitch. This wastes time, doesn't provide value and can lead a startup to their demise.
This conversion funnel can provide great structure and light into the overall health of your startup, but also give actionable insight into where you need to direct your time and money within your growth strategy.
With that said, you should have the metrics to each stage of this funnel at the tip of your tongue. Not to tell everyone you meet, rather so you constantly have best picture of your startups health.
Editor's note: I have added a stage and changed the order of Dave McClure's original conversion funnel
Awareness = megaphone

Spread the word
Description
The very top of the funnel. The total reach of your company. Goal here is to spread the awareness net as wide as you can to capture the most amount of people in stage two. However, that doesn't mean doing a shotgun styled growth strategy, because those never work. It means understanding your target market, your user-profiles and more importantly where they are en-mass.
Tracking
Depends on what type of awareness you're raising (website views, brand awareness, social chatter etc). Google Analytics, Twitter analytics, Facebook, etc. Mention is a social listening tool.
Measurement
One can look for social mentions, retweets, likes, shares, pageviews, app store views, tagging etc.
For tips in seeking out best ways to answer these questions, you can see my essays on the 19 channels for growth and how to prioritise your growth strategy.
Acquisition is the mission

Up and to the right
Description
Since we've just raised awareness of the product/service, it's time to convince our potential users to take their first action, such as, subscribing or installing. It is the very first step of the actual conversion process. Awareness has told the user about your business, but acquisition means they started to convert. You convinced them.
Tracking
Tracking at this stage can be done through a variety of analytics platforms. Personally I've used Fabric for real-time info, App Annie for more detail (although it's normally delayed) and any platform your channels run through, e.g. Facebook.
Measurement
Measure in numbers or rate (%). Up to you. We tracked registrations in both number and % growth rate.
Testing
Run growth experiments using the 19 channels for growth to find your core channels. Continually optimise and iterate those channels until saturated. I have an upcoming essay on Facebook Ad strategies you can use as a template for optimising and iterating your core channel.
Activation for the nation

A-HA!
Description
The a-ha moment! When your users find the true value of your product and therefore want to stick around (a-ha moment). It can also be when your users have performed a desired outcome e.g. become invested into the product by depositing money (which is not yet revenue), or if the users have played a game/sent a message.
Tracking
Use any top tier BI software to help map out every single user interaction in your product / service. Personally, I used Amplitude and Metabase - which are both independent of each other, and amazing.
Measurement
Measure the activation rate in %. This is the north star of this stage. You want to continually improve the activation rate and make it as high as possible, so there is minimum time from install to a-ha moment, therefore less time to see value prop and less churn.
Testing
Tip to find said a-ha moment:
Track every single event in your product/service
Segment users who started the user-journey with action X, Y and Z
Over time you will see which segment was more valuable and positively affected your OMTM - iterate starting points until you find the clear a-ha winner
Retention is king

Graph courtesy of Alex Schultz, VP Growth @ Facebook - the 30 is supposed to be a 0. Blue line shows viable business, red line shows failing business
Description
Shows the true health of your product. It is how you turn the acquisition and activation into growth. If people enjoy your product/service or it truly solves a problem then you will have returning users. As mentioned in a previous essay, you will start with low retention and a leaky product. Plug these holes through a number of tactics (shown below).
Key thing to look out for is whether you retention curve flattens after it tapers down from day 0. If it is flat you have a viable business, and have reached some level of product-market fit, for some small cohort of your total user-base. This is great news. Now it's time to grow that user-base!
Tracking
Personally, my product used Amplitude to understand our retention curves. We were able to segment users based on actions performed (such as the activation test mentioned before), to see if any action resulted in higher retention.
Measurement
Measure the retention rate in %. Whether you choose to measure in a daily, weekly, monthly or yearly rate depends on your business type. We were a weekly fantasy football game so focused on WAUs. An insurance startup might only need annual renewals so would focus on YAUs since their daily numbers would be awful.
Testing
This stage is where you streamline the product/service as much as possible so as to stop churn. In the past I've used:
Scheduled social retargeting - Facebook
Scheduled and event-triggered email retargeting - Sendgrid and Customer.io
Scheduled and event-triggered push notifications
Introducing new features
For the latter, analyse where there is drop-off in the product and brainstorm how a new feature or flow can resolve the issue. Try segmenting users based on behaviour or usage, e.g. top 5% of paying users, then beta test the new solution tailored to stop churn. If this works, rollout. If not, use data acquired as background knowledge to help optimise feature or flow and test again.
Revenue for the win

Make it rain
Description
Obvious. The monetisation of your users. The fruits of your labour. The revenue made through your business model, be it advertising, subscriptions, gambling or in-app purchases. It's what keeps the lights on.
Tracking
An important metric to keep track of is the LTV (lifetime value) of your users. From a growth perspective, this is a guiding light to how much you should be spending to acquire new users. By using the ratio LTV:CAC (customer acquisition cost) you can keep a tight grip on growth expenditure. Research says strive for a ratio of 3:1 if you want sustainable growth for your SaaS startup.
Used Metabase to scrape weekly revenue data.
Measurement
Knowing average revenue per user (ARPU) and average revenue per paying user (ARPPU) were most important for us.
Testing
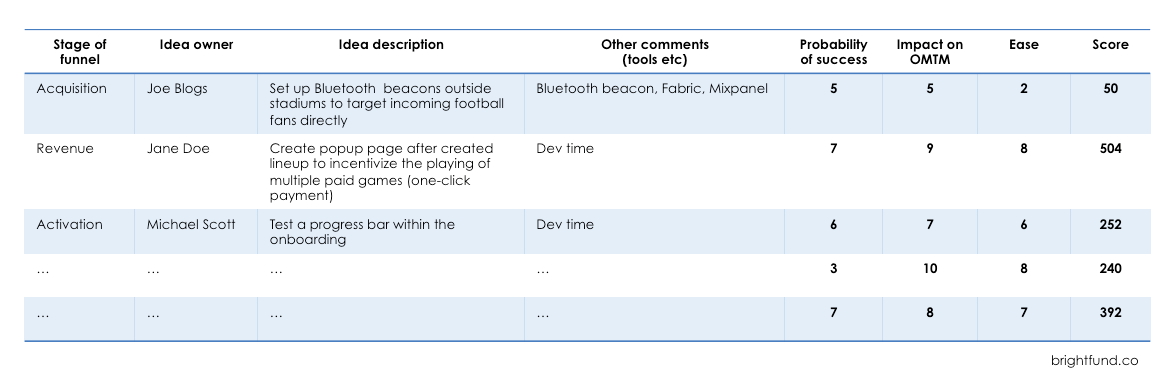
Similar to the retention test, you can figure out ways to get the most revenue out of users. What worked for us was implementing a popup after someone had just created a lineup and entered into a fantasy football pool game to incentivise them in entering the same lineup in multiple pool games. First tested our top 5% paying users, analysed results and then rolled out.
At this point in the funnel you can also try:
Funnel optimisation - improving each step of the conversion funnel through understanding how users move between them
Pricing optimisation - pricing can impact CAC through misplaced positioning, appealing to the wrong customer, and thus spending more to get the right customer
Referral machines are the best machines

The holy grail isn't just an old cup
Description
When a user refers another user. An incredibly powerful way to grow your business. The referred users are already vetted by the existing user, and will have a greater propensity to stick around. Two types of referral: organic and artificial.
Tracking
New users generated by active users. Tracked through app events in BI tools.
Measuring
Viral coefficient k>1 is the ideal scenario (like Dropbox viral growth) however, that is very unrealistic nowadays. We had a k factor of 0.36 which is pretty darn good in our space.
Testing
If the users aren't sharing your product organically, then you haven't created a product worth sharing (but that doesn't mean it sucks). You can still create test incentives artificially, such as, discounted prices, more storage, pure cash etc. This all can create referrals. Build a natural referral machine that is integral to your business to continually incentivise new and recurring users to refer friends.
If you liked this, you can find more and subscribe on the homepage of Bright Fund. Feel free to check more essays on growth, strategy and user acquisition.